
Vacuum is almost always presented as a pain point, a culprit, and an over exaggerated source of performance problems in PostgreSQL. The MVCC implementation in PostgreSQL is different from Oracle, SQL Server, MySQL or MariaDB, and that implementation introduces two requirements of its own, freezing transaction IDs, which is largely seamless, and clearing dead tuples through the various forms of vacuum. At the same time the PostgreSQL community is far ahead in minimizing the impact of vacuum. Each release has introduced enhancements substantial enough that most users never realize vacuum is something they could tune at all, and the list of vacuum specific improvements is long enough to deserve an article of its own. Among all of those optimizations, one of the most often missed is how to avoid the need for vacuuming in the first place. That is achievable most of the time, and it is not new.
Pavan Deolasee worked on the idea through 2006 and 2007 and authored the concept of the Heap Only Tuple, or HOT. Simon Riggs, Heikki Linnakangas, Tom Lane and many other PostgreSQL core team members and contributors have written a great deal of enhancement around it since. In this article we look at what PostgreSQL HOT updates actually are, how fillfactor decides whether they succeed, and how we identify which tables benefit. We then put it to the test with a HammerDB benchmark using the HammerDB TPROC-C workload against PostgreSQL 18.4, six 60-minute runs across three dataset sizes, and the improvement from correctly applied PostgreSQL HOT updates is substantial.
When PostgreSQL updates a row it writes a new version of that row and, normally, a new entry in every index on the table. A HOT update (heap-only tuple) skips the index work entirely. It requires two things - the new version must fit on the same 8 KB page, and no indexed column may have changed.
fillfactor addresses the first condition. At the default of 100 a page is packed full at load time; at 80 the loader leaves a fifth of each page empty as headroom for future updates. That is the whole idea, and it is why fillfactor is useless when the second condition is what is failing.
The measurement that matters
pg_stat_user_tables.n_tup_newpage_updcounts updates that could not stay on their page. It is the direct symptom fillfactor treats. If it is zero, fillfactor has nothing to fix.
The same workload was run at three dataset sizes chosen to sit either side of the two memory boundaries that matter, the buffer pool and total system RAM. Each size was run twice, once with PostgreSQL defaults and once with the tuned per-table fillfactor, giving six 60-minute measured runs in total.
| Dataset | Warehouses | Size on disk | vs shared_buffers (2 GB) | vs total RAM (7.8 GiB) | Expected regime |
|---|---|---|---|---|---|
| Small | 20 | 2.0 GB | fits | fits | Served from the buffer pool |
| Medium | 40 | 3.9 GB | 1.9x over | fits | Buffer misses, OS cache hits |
| Large | 100 | 10 GB | 5x over | 1.3x over | Forced eviction, real disk reads |
Each run is 5 minutes of ramp followed by 60 minutes measured, driven by 4 virtual users against 6 vCPUs. Database statistics were snapshotted every 5 minutes throughout, so the figures below show the shape of the hour rather than only its endpoints. That turned out to matter, because at fillfactor 100 the small dataset grew from 2.0 GB to 6.1 GB during its own run, so a configuration that started cache-resident did not stay that way.
Throughput is reported as NOPM, New Orders Per Minute, which is HammerDB's headline metric for TPROC-C. It counts only the New-Order transactions and is the equivalent of the TPC-C tpmC figure, a name reserved for audited results. HammerDB also reports TPM across all five transaction types, and in these six runs the two tracked at a constant ratio of 2.30, which is the TPC-C transaction mix behaving exactly as specified. That consistency is a useful check in itself, because a mix that drifted between the two arms would mean the comparison was measuring different workloads rather than different page layouts.
This is not a comparison against an out-of-the-box PostgreSQL. Both arms run on a cluster whose memory, WAL and checkpoint settings were sized for this machine's 6 vCPUs and 7.8 GiB of RAM first, so that the fillfactor difference is measured on top of a sensible configuration rather than standing in for one.
shared_buffers               = 2GB        -- 25% of RAM
effective_cache_size         = 6GB        -- ~75%, what the planner assumes is cached
work_mem                     = 8MB
maintenance_work_mem         = 512MB      -- so VACUUM timings are not memory starved
max_wal_size                 = 4GB        -- 4x the 1GB default, to reduce forced checkpoints
min_wal_size                 = 1GB
checkpoint_timeout           = 15min      -- 3x the default
checkpoint_completion_target = 0.9
track_io_timing              = on         -- required for pg_stat_io read/write times
track_wal_io_timing          = on
-- autovacuum left at DEFAULTS on purpose. Whether the stock thresholds
-- keep up with a bloating table is part of what is being measured.
Please Note: We could further optimize Checkpoints and some other settings, but we have't done that to keep this benchmark limited to HOT Updates. Please watch out for our future articles on the same.
The one deliberate exception is autovacuum, left entirely at its defaults. Raising those thresholds would have masked the maintenance cost that turns out to be one of the clearest differences between the two configurations.
The tuning wins at all three sizes, but the margin shrinks as the data outgrows RAM, because once storage is the binding constraint better page layout cannot conjure memory that is not there. The more useful result is not the throughput at all, it is which tables mattered, and the costs that never show up in a transactions-per-minute number.
We drove the whole thing with HammerDB 6.0, whose TPROC-C workload is derived from the TPC-C specification. Two configurations, three dataset sizes, sixty measured minutes each after a five-minute ramp. Every run started from a genuinely cold, identical state - drop the database, fstrim, drop the OS page cache, restart PostgreSQL, rebuild, apply the fillfactor, VACUUM FULL, then clear both cache layers a second time before the clock started.
That second cache clear matters more than it sounds. Clearing only before the load leaves each arm warm with whatever the load just touched, and how much of the dataset that represents depends on the dataset's size, which is exactly what fillfactor changes. Skipping it quietly favours the baseline.
A HOT update only pays off where both of its conditions can be met, so the selection is a filter, not a preference. We applied three tests to all nine TPC-C tables before touching any of them.
First, is the table UPDATEd at all? Fillfactor reserves space for future row versions, so on a table nobody updates it is 20 percent more pages bought for nothing. item is read-only, history is insert-only and new_order is insert-and-delete only, so all three were excluded immediately.
Second, are the UPDATEd columns indexed? This is the test that matters most and the one usually skipped, because if an indexed column changes then HOT is impossible at any fillfactor and the reserved space is pure waste. Answering it needs the real statement mix rather than the documented one, so we read the SET clauses straight out of pg_stat_statements and compared them against every column covered by an index. TPROC-C hides its SQL inside PL/pgSQL functions and CTEs, which means pg_stat_statements.track has to be set to all or the workload is invisible.
That produced a clear answer. Across nine tables and 92 columns, exactly eight columns are ever UPDATEd, and not one of them appears in any index. Every TPC-C index is on an identity column such as s_i_id or o_w_id, while every updated column is a balance, a counter, a quantity or a timestamp. HOT is therefore possible on all six updated tables, and the only thing deciding whether it succeeds is whether the page had room.
Third, is HOT actually failing? That is what n_tup_newpage_upd measures. Two tables came back with a real deficit at the default fillfactor and two came back essentially clean, which is what separated the four we tuned from the two we left alone.
| Table | Columns UPDATEd | Indexed? | newpage at ff100 | Decision |
|---|---|---|---|---|
order_line | ol_delivery_d | no | 20.0 - 31.5% | fillfactor 80 |
orders | o_carrier_id | no | 8.5 - 13.2% | fillfactor 90 |
stock | s_quantity | no | 1.4 - 8.6% | fillfactor 90 |
customer | c_balance, c_data | no | 2.7 - 18.2% | fillfactor 90 |
district | d_ytd, d_next_o_id | no | 1.5 - 5.5% | left at 100 |
warehouse | w_ytd | no | 0.9 - 1.2% | left at 100 |
new_order | none (insert, delete) | - | - | left at 100 |
history | none (insert only) | - | - | left at 100 |
item | none (read only) | - | - | left at 100 |
So only four of the nine tables get a fillfactor change, and they do not all get the same one. district and warehouse are the interesting exclusions, because both are updated constantly, both would be tuned by any rule of thumb, and both were measured at 99.6 and 99.95 percent HOT with the default already. The findings below explain why.
-- The tuned configuration. Derived from measured per-column evidence,
-- not applied uniformly.
ALTER TABLE customer   SET (fillfactor = 90);
ALTER TABLE stock      SET (fillfactor = 90);
ALTER TABLE orders     SET (fillfactor = 90);
ALTER TABLE order_line SET (fillfactor = 80);
-- warehouse, district        left at 100 - measured, no benefit
-- item, history, new_order   never UPDATEd at all
Both arms rewrite the same six tables with VACUUM FULL, so the only difference between them is the fillfactor value, not which tables got a freshly compacted heap.
Stripped of the harness, one arm of this HammerDB benchmark is three steps. Put the TPROC-C settings in a file, apply the layout, then run the timed workload.
# 1. Build the schema. Save as build.tcl, then run it.
dbset db pg
dbset bm TPROC-C
diset connection pg_host localhost
diset connection pg_port 5432
diset tpcc pg_superuser postgres
diset tpcc pg_superuserpass <password>
diset tpcc pg_dbase tpcc
diset tpcc pg_count_ware 20
diset tpcc pg_storedprocs false
diset tpcc pg_num_vu 4
buildschema
cd /opt/HammerDB-6.0 && ./hammerdbcli auto build.tcl
# 2. Apply the fillfactor and rewrite the heap so it takes effect on
#    existing rows. VACUUM FULL runs in BOTH arms, including the
#    fillfactor 100 baseline, or you are measuring the rewrite instead.
psql -d tpcc -c "ALTER TABLE order_line SET (fillfactor=80);"
psql -d tpcc -c "ALTER TABLE stock      SET (fillfactor=90);"
psql -d tpcc -c "ALTER TABLE orders     SET (fillfactor=90);"
psql -d tpcc -c "ALTER TABLE customer   SET (fillfactor=90);"
psql -d tpcc -c "VACUUM FULL order_line, stock, orders, customer;"
psql -d tpcc -c "VACUUM ANALYZE; CHECKPOINT; SELECT pg_stat_reset();"
# 3. Run the timed workload. Same file as step 1 with buildschema
#    swapped for the driver settings, then vurun.
diset tpcc pg_driver timed
diset tpcc pg_rampup 5
diset tpcc pg_duration 60
diset tpcc pg_allwarehouse true
loadscript
vuset vu 4
vucreate
vurun
Then read the result. This is the query that produced every HOT number in this article, and it is the one worth running against your own schema whether or not you care about TPC-C.
SELECT relname,
       n_tup_upd, n_tup_hot_upd, n_tup_newpage_upd,
       round(100.0 * n_tup_hot_upd     / NULLIF(n_tup_upd,0), 2) AS hot_pct,
       round(100.0 * n_tup_newpage_upd / NULLIF(n_tup_upd,0), 2) AS newpage_pct,
       n_dead_tup, pg_size_pretty(pg_table_size(relid)) AS heap
  FROM pg_stat_user_tables
 WHERE n_tup_upd > 0
 ORDER BY n_tup_upd DESC;
Between the two arms you reset the database completely rather than truncating it - drop it, clear the OS page cache, restart PostgreSQL, rebuild. Anything less leaves free-space-map and visibility-map state behind, and the second run inherits the first one's page layout.
| Dataset | fillfactor 100 | Tuned | Gain |
|---|---|---|---|
| 20 warehouses / 2.0 GB | 36,597 NOPM | 54,106 NOPM | +47.8% |
| 40 warehouses / 3.9 GB | 21,631 NOPM | 26,645 NOPM | +23.2% |
| 100 warehouses / 10 GB | 11,664 NOPM | 13,239 NOPM | +13.5% |
The tuned config wins at every size. The margin falls from +47.8 percent to +13.5 percent as the dataset goes from fitting in the 2 GB buffer pool to being 1.3x total RAM.
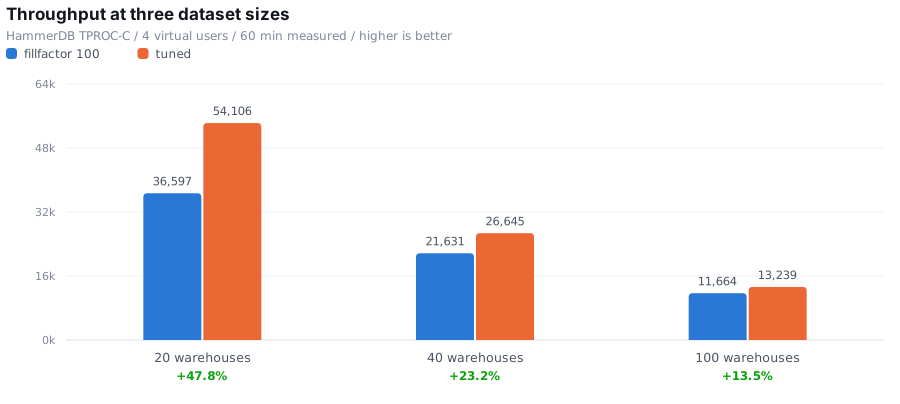
Absolute throughput falls 3.1x across the three sizes for the baseline, which is the dataset outgrowing memory and happens to both arms. What narrows is the benefit. At 20 warehouses the tuned arm avoided 15 checkpoints and read half as many blocks from disk; at 40 warehouses it avoided 2 checkpoints and read exactly as many blocks. Both arms ran with the same WAL and checkpoint settings. The second-order wins evaporate once everything is coming off storage anyway.
PostgreSQL consulting across tuning, architecture and day to day operations.
Automated conversion of the code objects that decide a migration timeline.
Homogeneous and heterogeneous data movement, validated end to end.
Share of updates that stayed on-page, higher is better.
| Table / dataset | fillfactor 100 | Tuned | Change |
|---|---|---|---|
order_line / 20 wh | 68.48% | 99.16% | +30.7 |
order_line / 40 wh | 70.02% | 98.57% | +28.5 |
order_line / 100 wh | 79.97% | 98.79% | +18.8 |
stock / 20 wh | 98.63% | 99.83% | +1.2 |
stock / 40 wh | 97.22% | 99.98% | +2.8 |
stock / 100 wh | 91.37% | 99.9995% | +8.6 |
The tuned arm lands at 98.6 to 99.2 percent on order_line and 99.8 to 100 percent on stock at every dataset size. The fix does not weaken under pressure, only what it buys you does.
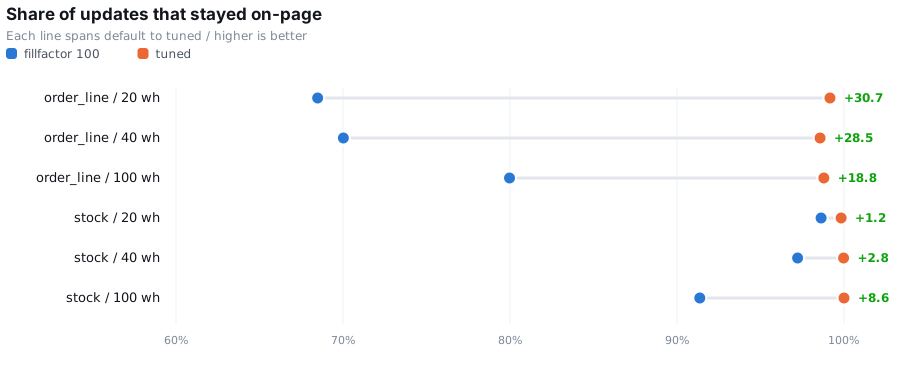
Two things worth pulling out. First, order_line at fillfactor 100 fails 28 to 32 percent of its updates, so nearly a third of them write a new tuple plus fresh index entries. Second, the two tables swap places as the dataset grows, since stock is healthy at 20 warehouses (98.6 percent) and broken at 100 (91.4 percent), while order_line improves slightly. Dataset size does not just scale the pressure, it changes which table is the bottleneck.
order_line at 20 warehouses, sampled every five minutes. Both arms start after an identical VACUUM FULL.
| Minute | Heap ff100 | Heap tuned | Dead tuples ff100 | Dead tuples tuned |
|---|---|---|---|---|
| 0 | 533 MiB | 670 MiB | 0 | 0 |
| 10 | 1,080 MiB | 1,414 MiB | 731,984 | 258,824 |
| 20 | 1,457 MiB | 2,092 MiB | 405,745 | 259,486 |
| 30 | 1,795 MiB | 2,820 MiB | 557,626 | 185,430 |
| 40 | 2,171 MiB | 3,475 MiB | 1,389,154 | 246,859 |
| 50 | 2,533 MiB | 3,984 MiB | 1,188,430 | 451,368 |
| 60 | 2,943 MiB | 4,503 MiB | 468,281 | 325,479 |
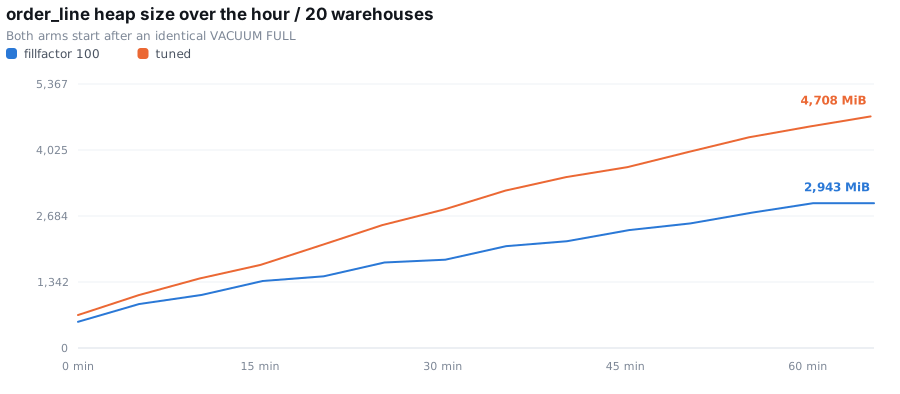
Both grow, because order_line is insert-driven and growth is expected. The tuned arm grows faster in absolute terms because it completed 48 percent more transactions. Per transaction the heap costs 13 percent more and the indexes 29 percent less, and the two nearly cancel at 717 versus 722 bytes.
This is the one place a raw chart misleads, and it is worth being explicit about. Bigger is not worse here. Normalised per transaction the two arms store almost identically while one of them is doing half as much work again.
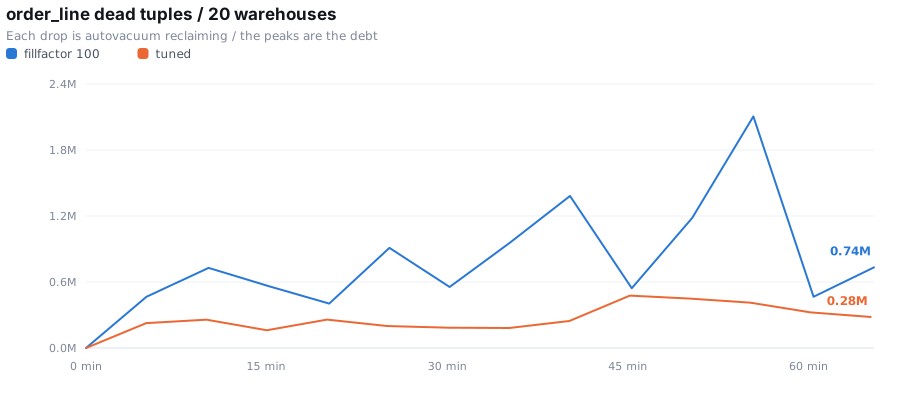
The dead-tuple series is where the difference is unambiguous. The baseline's sawtooth climbs to 2.1 million dead tuples before autovacuum catches it. The tuned arm peaks at 479k while processing more transactions, and each of its dead tuples is a HOT tuple, prunable on the page without touching an index.
Time to vacuum stock immediately after each 60-minute run.
| Dataset | fillfactor 100 | Tuned | Difference |
|---|---|---|---|
| 20 warehouses | 9.3 s | 6.8 s | 1.4x faster |
| 40 warehouses | 40.1 s | 5.8 s | 7.0x faster |
| 100 warehouses | 72.5 s | 40.3 s | 1.8x faster |
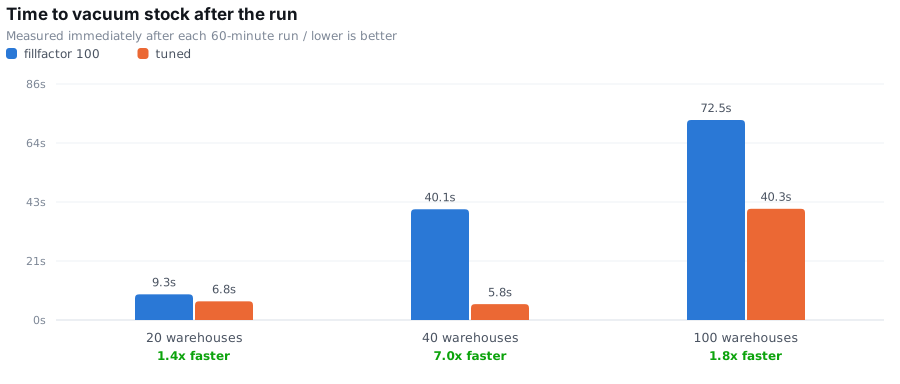
The baseline's vacuum cost grows 8x across the three sizes, from 9.3 s to 72.5 s. At 40 warehouses the tuned arm is 7x faster to vacuum. None of this appears in a NOPM figure, but it is exactly the cost that routine vacuuming has to absorb.
And the physical growth of stock, which is update-only rather than insert-driven, tells the same story without any normalisation caveat.
| Dataset | stock heap growth, fillfactor 100 | stock heap growth, tuned | Difference |
|---|---|---|---|
| 20 warehouses | 97 MB | 24 MB | 75% less |
| 40 warehouses | 132 MB | 2 MB | 99% less |
| 100 warehouses | 225 MB | 0 MB | not one page in an hour |
Of TPC-C's nine tables, three should never be touched. item is read-only, history is insert-only, new_order is insert-and-delete only. Fillfactor on any of them is pure waste, 20 percent more pages for zero updates to accommodate.
Two more measured no benefit. warehouse and district. That result is the counter-intuitive one. warehouse takes over 100,000 updates per row and sits at 99.95 percent HOT at the default fillfactor, because HOT pruning is opportunistic and fires on page access, so a table whose pages are hammered constantly keeps reclaiming its own space. It is self-healing.
The rule that emerged
Fillfactor is not for "hot tables". It is for insert-then-update tables. A row inserted once, packing its page full, and updated later has nowhere to go.
order_linetakes 0.77 updates per row and fails 28 percent of them.warehousetakes 123,755 updates per row and fails 0.05 percent.
Reserve costs working set permanently. Past the point where HOT saturates, it buys nothing and is still paid for. We measured the required amount per table, and it is not a constant.
| Table | ff 100 | ff 90 | ff 80 | Right answer |
|---|---|---|---|---|
stock | 99.12% | 99.96% | 99.99% | 90 |
orders | 90.71% | 99.69% | 99.89% | 90 |
customer | 98.24% | 99.67% | 99.98% | 90 |
order_line | 72.73% | 90.27% | 99.42% | 80 - 90 is not enough |
Step the value down and watch n_tup_newpage_upd. The first value that drives it to zero is the answer; going further is a throughput regression. In a companion pgbench test, fillfactor 80 on pgbench_accounts reached exactly the same 100 percent HOT as fillfactor 90 and cost 29 percent throughput for the privilege, because the extra reserve inflated the table 24.5 percent against a 1 GB shared_buffers pool.
Before you reach for fillfactor at all
A poor HOT ratio is usually a schema problem, not a tuning problem. Every one of TPC-C's eight updated columns is unindexed, and every one of its eleven indexes is on an identity column, which is why it reaches 99 percent HOT with no configuration whatsoever. Adding a single index on
stock.s_quantitydrops that table from 99.94 percent to 0.00 percent, at any fillfactor. Removing an index on mutable state is the first-order fix. Our HexaCluster PostgreSQL consulting team reviews exactly this class of schema problem during performance engagements.
| Run | WH | NOPM | order_line HOT | stock HOT | WAL | WAL/txn | Ckpts | VACUUM stock |
|---|---|---|---|---|---|---|---|---|
| fillfactor 100 | 20 | 36,597 | 68.48% | 98.63% | 94.3 GiB | 20,050 B | 45 | 9.3 s |
| tuned | 20 | 54,106 | 99.16% | 99.83% | 62.1 GiB | 8,925 B | 30 | 6.8 s |
| fillfactor 100 | 40 | 21,631 | 70.02% | 97.22% | 98.2 GiB | 35,324 B | 47 | 40.1 s |
| tuned | 40 | 26,645 | 98.57% | 99.98% | 94.3 GiB | 27,543 B | 45 | 5.8 s |
| fillfactor 100 | 100 | 11,664 | 79.97% | 91.37% | 82.2 GiB | 54,876 B | 39 | 72.5 s |
| tuned | 100 | 13,239 | 98.79% | 99.99% | 70.3 GiB | 41,285 B | 33 | 40.3 s |
PostgreSQL HOT updates are the cheapest vacuum optimization available, because a HOT update never creates index bloat and its dead tuple can be pruned on the page itself without any index work. Getting them is not a matter of setting fillfactor 80 everywhere. In this HammerDB benchmark only four of TPC-C's nine tables benefited at all, and they did not all want the same value. Three tables are never updated, so reserving space on them buys nothing, and two more were already succeeding above 99.6 percent at the default because their pages are touched so constantly that opportunistic pruning keeps reclaiming their own space.
The rule that came out of the measurements is that fillfactor is for insert then update tables rather than for busy tables. A row inserted once into a page that is already full has nowhere to go when the update arrives later. That is why order_line, at 0.77 updates per row, failed roughly a third of its updates while warehouse, at over 120,000 updates per row, failed almost none. When you do apply a reserve, use the smallest one that drives n_tup_newpage_upd to zero, because anything beyond that is working set given away for no return.
Across three dataset sizes the tuned configuration gained 47.8 percent, 23.2 percent and 13.5 percent in throughput as the data grew from fitting in memory to exceeding it. The margin narrows because storage eventually becomes the binding constraint, but the maintenance benefits do not narrow at all. The stock table grew by 225 MB in an hour at the default and by nothing whatsoever when tuned, and post run vacuum was up to seven times faster. Those costs never appear in a transactions per minute figure, which is exactly why they are worth measuring directly. Two caveats belong with the numbers. Each cell was run once rather than repeated, and the tuned arm always ran second in its pair, inheriting a storage subsystem still absorbing the previous run, so every improvement reported here is a conservative one.
Before reaching for fillfactor at all, check the schema. A poor HOT ratio is usually an index on a column that changes, and no fillfactor setting can rescue that. Every one of TPC-C's eight updated columns is unindexed and all eleven of its indexes sit on identity columns, which is why it reaches 99 percent HOT with no configuration whatsoever. Find the updated columns first, check them against your indexes, and only then decide whether any page needs headroom.
Everything in this article is reproducible, but running it against a production schema, interpreting the numbers, and deciding what to change is a different job. Our PostgreSQL performance tuning engagements start exactly here. An architectural health audit covers the wider picture - provides short-term, mid-term and long-term recommendations upon analyzing the database workload and the application topology.
If you are migrating off legacy or complex Oracle, SQL Server, MySQL or MariaDB, physical layout is worth deciding before the data lands rather than retrofitting it afterwards. HexaCluster provides end to end database migration to PostgreSQL and application migration and modernization, with HexaRocket automating the schema and code conversion. Once you are live, we also offer managed DBA services and 24x7x365 support.
To start a conversation, or to have this HammerDB benchmark run against your own schema, write to us at connect@hexacluster.ai or reach the HexaCluster PostgreSQL consulting team.
Subscribe to our newsletter and stay tuned for more on PostgreSQL internals. The list of vacuum specific enhancements we mentioned at the top is an article of its own, and it is next.

Avi is the CEO and Co-founder of HexaCluster. Avi has a rich background in PostgreSQL, development, and machine learning. Before joining HexaCluster, he co-founded MigOps, a company dedicated to facilitating migrations to Open-Source databases like PostgreSQL. His journey in the PostgreSQL domain started at Dell followed by OpenSCG as a Database Architect and later joined Percona to start the PostgreSQL practice. Avi loves contributing to PostgreSQL, speaking at PostgreSQL conferences and writing PostgreSQL books.
Start your migration journey 🚀
start your migration journey with our expert team
Database & Application Migration Assessment Tool
End-to-End Database Migration & Modernization Tool
Database Code Object Conversion to PostgreSQL
MyBatis Mapper Conversion to PostgreSQL
Enterprise Data Replication & Live CDC
Oracle Compatibility Layer for PostgreSQL